
How To Practice Technical Analysis
When you get some free time and want to improve your understanding of price action and currency behavior… Open a chart, zoom right out, draw in 3 or 4 of the best support/resistance lines you can find, and study them!
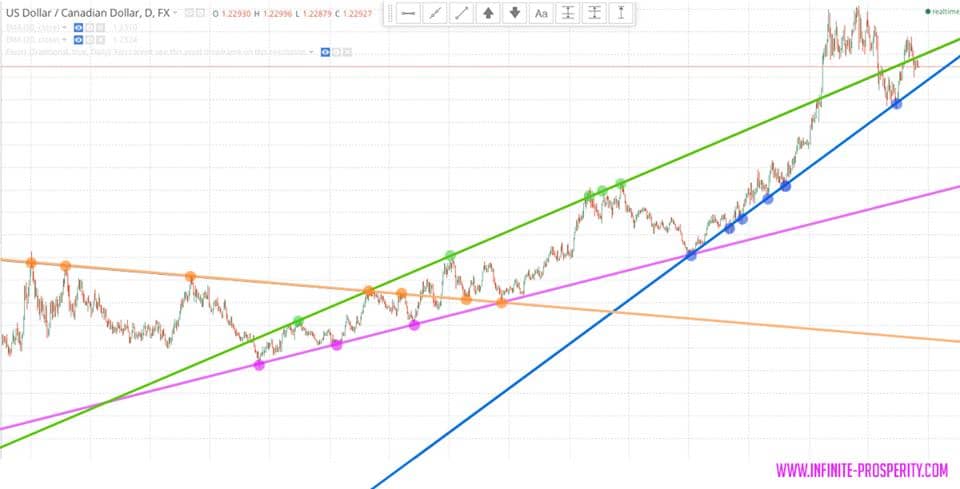
It’s mind-blowing to see how often these lines are hit by the market over and over again.
The chart featured in this post includes lines that date back 3 years! I often do this with my intern, Jake. To prove the point, I even drawn in lines that date back to 1991 and are still creating turning points today.
Once you’re happy with your lines, zoom back in and study each line-touch. Pay close attention to the 4 critical technical characteristics we look for in the Infinite Prosperity Strategies:
- Market Condition
- Market Phase
- Key Support/Resistance (already established by your lines)
- Deceleration
Take a look at how price often begins to decelerate as it approaches the lines. Notice any price patterns or candlestick patterns that form right around these areas. Take note of what you believe to be the “highest probability” set ups. These often occur when price bounces off the precise cross of two significant support lines, or when there is a touch in line with the predominant trend.
Can you spot them in the image below?
When you identify these past entries, take notice of how far the market moved, and where you could place hypothetical profit target orders to capture your profit. Quite often the best place to position these target orders is just before the next touch of a major trend line or horizontal S/R line.
Studying charts like this helps to ingrain market character and price action into your subconscious mind. We have found it to be one of the best ways to break away from the “cutting profits short” mentality that plague most new traders who run a fear pattern around losing their unrealised profits.
Leave a Comment